CHROMATOGRAPHY
I have thrown everything here and I will sort this note in a few days...
A little History
The word
means “colour writing”, and the first
chromatographic
separations were of coloured materials (dyes, inks)
Chromatography
was
discovered by
M.S.Tswett in 1903
discovered by
M.S.Tswett in 1903
During
chromatography three components interact
Sample
(target analyte to be separated from matrix
interferences)
-
biological fluid such as urine or blood
-
A
mixture of proteins or enzymes
Stationary
phase (immobilised)
- Paper
(cellulose fabric)
- Thin
plate covered in particles of different surface properties
-
Particles
packed into a column of glass or metal
Mobile
phase (solvent)
-
Typically
a gas as in Gas chromatography (GC) or a liquid as in liquid chromatography
(LC)
-
Interactions
between components vary according to the type of chromatography
Some main techniques
Paper:
Stationary phase is cellulose fibre.
Mobile phase passes by capillary action.
Thin layer:
Stationary phase is attached to matrix and coated on glass, plastic or metal plate.
Mobile phase passed over by capillary action (different samples can be run simultaneously)
Column:
Stationary phase attached to matrix packed into a glass or metal column.
Mobile passes through the column
Applications
of chromatography in Biosciences
first, consider the importance of context
purify components (target analytes) from a complex mixture
urine, blood, plasma, tissue extracts, soil samples
identify components using qualitative analysis
proteins, peptides, endogenous molecules such as markers
of disease, xenobiotics, drugs of abuse, pesticides
size of molecules is all important. 100 or 10000 molecular weight?
how complex is the sample and what could interfere with measuring the target analyte?
measure components using quantitative analysis
A Target Analyte
The
concept of a target analyte in an assay refers to a chemical constituent or
constituents which need to be identified and quantified (characterised) in
answer to a specific scientific hypothesis
Is a
drink-driver suspect’s measured blood alcohol level >or < or = 80 mg
ethanol/ml blood? (legal contexts)
Is an
individual’s cholesterol level decreasing due to statin therapy, or does he
need a higher dose? (clinical contexts)
Are levels
of pesticides in London’s drinking water below the European guidelines on
public health? (environmental contexts)
What are
interfering constituents in the sample matrix?
Revise the
constituents of blood ( and urine)
Main constituents of blood,
Plasma and urine are?
Hint: pH, density, cells, size, proteins, enzymes,
buffering
What to do about the clotting process?
How is the
sample prepared for chromatography?
The concept of partitioning
Separations
are based on differential migration through a porous medium
Different chemical species prefer to occupy different physical environments (phases)
These chemical species will move to occupy their preferred environment if exposed to two different environments at the same time
This is known as partitioning and results in the separation of the two species
molecules separate (partition) on the basis of:
Size, Shape
Mass, Charge
Solubility
Adsorption properties
some basic techniques of separation
•
filtration: select components by particle size
•
floatation: select components by density
•
crystallization: select components by solubility
•
extraction: select components by solubility
•
distillation: select components by boiling point
•
chromatography : select components by
affinity for a 'stationary phase'
Paper
chromatography
Stationary phase is cellulose fibre.
Mobile phase passes by capillary action.
Mobile phase passes by capillary action.
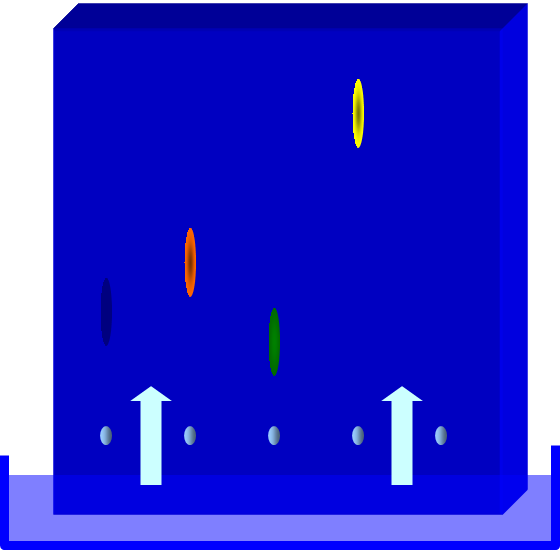
Thin Layer Chromatography
where stationary phase is polar (silica) and mobile phase is non-polar (hexane)
this is termed NORMAL PHASE CHROMATOGRAPHY
where stationary phase is polar (silica) and mobile phase is non-polar (hexane)
this is termed NORMAL PHASE CHROMATOGRAPHY
Yellow
constituent has the highest affinity for the solvent
Green
constituent has higher affinity for the stationary phase
Apply
sample above
the mobile
phase
Column Chromatography
Which mobile or stationary phase?
The choice of mobile or stationary phase depends on the characteristics of the compound (solute) being separated.
Methods are routinely available in labs, textbooks, references and scientific papers
Numerous combinations of Stationary and Mobile Phase are possible, separation depends on temperature, pH and other physical factors:
Adsorption equilibrium
Partition equilibrium
Ion-exchange equilibrium
Size equilibrium
Affinity equilibrium
Adsorption equilibrium:
between solid stationary and a liquid mobile phase (adsorption and hydrophobic interaction chromatography)
Partition equilibrium:
between stationary liquid phase and a mobile liquid or gas phase (Partition, reverse-phase, ion-pair, gas-liquid and countercurrent chromatography)
Ion-exchange equilibrium:
between stationary ion exchanger and mobile electrolyte phase (ion-exchange and chromatofocusing)
Next weeks
practical uses ion-exchange TLC to separate ATP, ADP and AMP:
Adenosine
= adenine + ribose, on the basis of different charges
Size equilibrium:
between liquid phase trapped in stationary porous structure and a mobile liquid phase (size exclusion chromatography)
Affinity equilibrium:
between stationary immobilised ligand and a liquid mobile phase (affinity, immunoaffinity, metal chelating covalent chromatography)
between liquid phase trapped in stationary porous structure and a mobile liquid phase (size exclusion chromatography)
Affinity equilibrium:
between stationary immobilised ligand and a liquid mobile phase (affinity, immunoaffinity, metal chelating covalent chromatography)
Solvent polarities (remember like dissolves like)
water most polar
methanol
ethanol
propanone (acetone)
ethyl acetate
diethylether decreasingly polarity
dichloromethane
toluene
cyclohexane
petroleum ether
hexane least polar
water most polar
methanol
ethanol
propanone (acetone)
ethyl acetate
diethylether decreasingly polarity
dichloromethane
toluene
cyclohexane
petroleum ether
hexane least polar
Liquid/liquid
The
concept of partitioning
the toxic
chemical constituents in a solution/mixture of mussels
If
contaminated mussels
cause food
poisoning
deaths,
this experimental
strategy
could be used
to
determine the toxic
constituent
By testing
solvents or
residues
in mice, it is
possible
to determine
which
extract contains
the toxin
The two
separation techniques chromatography (partition) and electrophoresis (size and
charge) separate on different properties of the analytes. They are both used to
locate the toxin, which is finally confirmed by characterising the chemical
structure.
The chromatography process
load the analytes on top of the column or at the base of the thin layer.
Introduce the mobile phase
the components differentially eluted through the matrix material (development)
the separated analytes are separated into fractions or cuts
What determines how compounds separate?
Partition Coefficient a :
This is dependent on the relative affinity for the mobile and stationary phase
Partition Coefficient may be 0 and 1
The greater the value the more affinity for stationary phase
molecules adsorb on the stationary phase
a = ---------------------------------------------
Molecules in mobile and stationary phase
Detectors (more in later lectures)
universal detector responds to all compounds eluting from a column
(John Wrights optical methods lectures)
selective/specific detector responds only to certain elements or functional groups
sensitivity: the ratio of detector signal to sample size (or detector response per amount of sample)
Minimal detectable level (MDL) the amount of sample in which the peak height is at least twice the noise height
Partition Chromatography
In Partition Chromatography there is a partition equilibrium between a stationary liquid phase and a mobile liquid or gas phase
Examples include:
Partition, reverse-phase, ion-pair and gas
liquid chromatography.
Partition can be predicted by the partition coefficient, a , of a substance
Concentration of compound in
solvent A at equilibrium
a = ---------------------------------
Concentration of compound in
solvent B at equilibrium
Two principle forms of partition chromatography:
Normal phase (as we saw in the earlier TLC example)
polar stationary phase such as silica
non-polar mobile phase such as organic solvent hexane, ethylacetate, dichloromethane
Separation results as the analyte displaces molecules of the mobile phase
The least polar molecules will elute first,
Polar elute molecules last
Highly polar molecules may require polar gradient
elution (more on gradients later)
Reversed phase chromatography
Non-polar stationary phase
Only non-polar interactions with the stationary phase are possible
The bonded liquid stationary phase is usually alkylsilicane attached to silica
Common groups:
Butyl (C4)
Octyl (C8)
Octadecyl (C18)
Non-polar stationary phase
Only non-polar interactions with the stationary phase are possible
The bonded liquid stationary phase is usually alkylsilicane attached to silica
Common groups:
Butyl (C4)
Octyl (C8)
Octadecyl (C18)
Common mobile phases for reversed phase include:
Water
Aqueous buffers
Acetonitrile
Usually in a mixture
Separation is achieved by altering the mobile phase
Significant changes may be made by varying salt, pH or organic solvent
Polar molecules elute first
Non-polar molecules elute last
Non-polar molecules may also require a low polarity gradient in the mobile phase to remove them from the column
Ion
exchange chromatography
definition
of ion exchange
ion
exchange chromatography is broadly defined as the separation of compounds based
on the attraction of oppositely charged molecules
in
other words, can be used to separate charged molecular species
This
physical separation relies on differential partitioning of charged ions between
2 phases: stationary phase (solid support material) and mobile phase (solvent)
Ionization Equilibria for aqueous solutions
ion
exchange in biology
many
biological materials have ionisable groups: amino acids and proteins
the
fact that they carry a net + or – charge can be exploited in separating them
the
net charge depends on their pKa and the pH of the solution
(Henderson-Hasslebach equation)
ionisable
stationary phase
ion
exchange materials are known as anionic
or cationic according to their affinity for either negative or
positive ions. (an) (Cap)
these
materials can be grouped into 2 further groups
strongly ionised -SO3H and –N+R3
weakly ionised –COOH, -OH, -NH2
Paper chromatography
Stationary phase is cellulose fibre.
Mobile phase passes by capillary action.
Stationary phase is cellulose fibre.
Mobile phase passes by capillary action.
TLC
•
Liquid chromatography system consists of a
stationary phase, usually alumina, silica gel or cellulose and a mobile phase
(solvent)
Resolution and spot size in TLC
Rs = X
0.5 (d1 + d2)
X is the distance between the centres of the 2
spots and d1 and d2 are the average diameters of the spots
Components are just separated when Rs = 1
So, it is possible to increase resolution either
by increasing the separation of the spots or by decreasing the diameter of the
spots (HOW?)
Stationary phases –
TLC plates
TLC plates
•
Thin layer of adsorbent spread onto a glass,
plastic or foil plate in a slurry form, then dried at high temperature
•
Final surface of plate is almost chalk-like, so
avoid touching or scraping the surface off
•
Weak adsorbents: Sucrose, starch, talc
•
Medium: calcium carbonate, magnesia, calcium
hydroxide (surface area of 10-50 metres/gram)
•
Strong: activated silica, silica gel and alumina
(surface area of 100-500 metres/gram)
Strongly ionised groups
-SO3H
and –N+R3
are
completely ionised and are charged except at extreme pH values
acidic
conditions -SO3H
under
basic conditions gives -SO3- + H+
basic
conditions -NR3OH
under
acidic conditions gives –N+R3 + OH-
weakly
ionised groups
–COOH,
-OH, -NH2
in
ion exchange materials provide pH dependent groups whose maximum capacity is
over a narrow pH range
-COOH
reversibly gives – COO- + H+
-NH3+
reversibly gives – NH2 + H+
an
ion exchange matrix (resin)
polystyrene cross-linked with divinyl benzene
(insoluble resin)
selectivity can be modified by adding different
functional groups (give example in class)
properties
of ion exchange resins
•
PSDVB
resin swells in contact with water (care in packing the column)
•
extent
of swelling depends on the degree of crosslinking
•
the
greater the DVB content the less water is retained
•
cross-linking
can be controlled to obtain a sieving effect as well as ion exchange
Cellulose
•
Plant material, porous structure, smaller pores
than paper
•
Solvent flows evenly and spots are tight
•
Used to separate hydrophilic compounds such as
sugars, amino acids, soluble inorganic ions and nuclei acids (these would
adhere too strongly to silica or alumina)
chemically-modified
cellulose
•
alternative
to PSDVB
•
available
in gel and bead forms
•
good
flow properties
–
carboxymethylcellulose
= CM cellulose (weakly acidic)
–
Polyethyleneimine
= PEI cellulose (weakly acidic)
–
diethylaminoethylcellulose
= DEAE cellulose (strongly basic)
Chemistry
of Adenosine
a
simple
ion exchange column
ion exchange column
•
describe how to pack a column
•
how to collect fractions
•
commercial resins may contain iron or other heavy
metals that must be removed by washing with appropriate solution
anion
exchange mechanism
•
positively
charged groups
•
attract
negatively charged molecules
•
use
a cationic buffer: Tris, pyridine, alkylamines
5
steps
- diffusion of ion to the exchanger surface
- diffusion of ion through matrix to the exchange site
- exchange of ions at exchange site
- diffusion of the exchanged ion through the matrix to the surface
- selective desorption of the target ion by the eluant
anion
exchange TLC practical (SAX)
•
separation
of ATP, AMP and adenosine
•
Polyethyleneimine (PEI)-cellulose is a weak
anion exchange chromatographic packing material.
•
At acid
and neutral pHs the material is positive charged
•
It will thus bind negative ions (ATP, ADP and
AMP)
•
Adenosine is neutral and does not bind to the
plate
Beer
lambert law
anion
exchange HPLC (SAX)
Pepsins in
Human Gastric Juice
The PL-SAX can be routinely used for the
The PL-SAX can be routinely used for the
identification of pepsins 1, 5, 3a, 3b and 3c
in peptic ulcer disease.
Excellent resolution facilitates quantitation, if
required.
Sample: 250µl
human gastric juice dialyzed against 0.05M sodium acetate, pH 4.1.
Filtered 0.45µm.
Column: PL-SAX 1000Å 8µm, 50x4.6mm
Eluent A: 50mM Sodium acetate, pH 4.1
Eluent B: A + 1.0M NaCl
Gradient: 0-100% B in 20 mins
Flow Rate: 1.0ml/min
Detector: UV, 280nm
Eluent A: 50mM Sodium acetate, pH 4.1
Eluent B: A + 1.0M NaCl
Gradient: 0-100% B in 20 mins
Flow Rate: 1.0ml/min
Detector: UV, 280nm
cation
exchange mechanism
•
negatively
charged groups on exchanger
•
attract
positively charged molecules
•
use
an anionic buffer: acetate, barbiturate & phosphate
Sepharose
type exchangers
•
cross-linked
agarose
•
good
for separating high molecular weight proteins and nucleic acids
•
possibly
some molecular sieving also occurs
cation
exchange HPLC (SCX)
•
Standard
Protein Separation
Proteins which have a +ve charge at pH 6.0 will be retained by the cation exchanger. The more basic the protein, such as lysozyme (pl 11.8), the longer the elution time from the column under a typical NaCl gradient
Proteins which have a +ve charge at pH 6.0 will be retained by the cation exchanger. The more basic the protein, such as lysozyme (pl 11.8), the longer the elution time from the column under a typical NaCl gradient
Column: PL-SCX 1000Å 8µm, 50x4.6mm
Eluent A: 20mM KH2PO4, pH 6.0
Eluent B: A + 1.0M NaCl
Gradient: 0-100% B in 20 mins
Flow Rate: 1.0ml/min
Detector: UV, 280nm
KEY
1. Myoglobin
2. Chymotrypsinogen A
3. Cytochrome C
Eluent A: 20mM KH2PO4, pH 6.0
Eluent B: A + 1.0M NaCl
Gradient: 0-100% B in 20 mins
Flow Rate: 1.0ml/min
Detector: UV, 280nm
KEY
1. Myoglobin
2. Chymotrypsinogen A
3. Cytochrome C
choice
of ion exchanger 1
•
stability
of target analytes and sample matrix
•
molecular
weight
•
biological
components often need narrow pH range
•
must
select exchanger carefully on this basis
•
if
a sample is most stable below its isoionic
point giving it a net + charge, use a cation exchanger
•
conversely,
if it is most stable above its isoionic
point giving it a net – charge, use an anion exchanger
•
samples
stable over a wide pH range may be able to use either (see which works best)
weak
electrolytes
•
that
need either a very low or high pH for ionisation can only be separated on
strong exchangers
strong
electrolytes
•
use
a weak exchanger
•
less
chance to denature the sample
•
weak
X does not bind weakly charger impurities
•
enhanced
elution characteristics
gradient
elution
•
continous
or step-wise
•
ionic
strength gradients
•
pH
gradients
gradient
elution for amino acids
•
use
a strong acid cation exchanger
•
introduce
sample at pH 1-2
•
this
ensures binding of all amino acids
•
gradient
elution using increasing pH and ionic concentration gives sequential elution of
amino acids
•
acidic
AAs aspartic and glutamic elute first
•
neutral
AAs next: glycine and valine
•
basic
AAs lysine and arginine keep the net + charge up to pH value 9-11 and elute
last
amino
acid analyser
- Proteins are first converted to their constituent amino acids by hydrolysis in constant boiling hydrochloric acid, at 110C, under vacuum for 24 hours.
- After removal of the acid, the amino acids are separated by ion exchange chromatography, using a stepwise buffer gradient on a strong cation exchange column. The acidic amino acids elute first, followed by the neutrals, then the basic ones at the end.
- After separation, amino acids are visualised by their reaction with ninhydrin.
4. They
are quantified by comparison with a calibration mixture of amino acids.
TLC
•
Liquid chromatography system consists of a stationary
phase, usually alumina, silica gel or cellulose and a mobile phase (solvent)
Paper chromatography
Stationary phase is cellulose fibre.
Mobile phase passes by capillary action.
Stationary phase is cellulose fibre.
Mobile phase passes by capillary action.
The concept of competitive equilibrium
•
Partitioning of molecules of the sample between
stationary and mobile phase
•
10 possible interactions:
•
Solute-solute (association & dissociation)
•
Solute-solvent
•
Solvent-solvent
•
Solute-adsorbent-solvent (sorption &
desorption)
Adsorption is the basis of TLC
•
Adsorption is the ability of a solid to attract other molecules to its surface and
to hold them at the surface
•
Adsorbents have porous surfaces, which increases
surface area for adsorption
•
No chemical reaction occurs between adsorbents
and adsorbed materials
•
Adsorbents can be chemically altered to give
different selectivities
Stationary phases – TLC plates
•
Thin layer of adsorbent spread onto a glass or
foil plate
•
Weak adsorbents: Sucrose, starch, talc
•
Medium: calcium carbonate, magnesia, calcium
hydroxide (surface area of 10-50 metres/gram)
•
Strong: activated silica, silica gel and alumina
(surface area of 100-500 metres/gram)
Properties of Stationary phases
•
Inert material
•
Reproducible (same chemical state each time?)
•
Heat plates to deactivate, remove moisture
•
Particle size is important – why?
•
Layer thickness is important why?
–
0.25mm, 0.5 mm, 1.0 and 2.0 mm
–
Up to 1 mg per plate is analytical scale
–
>>> 1 mg overloads the plate and loses
efficiency of separation
•
Commercial plates – binder (G), no binder (H),
fluorescent indicator (F254)
Silica gel
•
Surface is covered in silanol groups (-Si-OH)
•
Different gels have different numbers of –Si-OH
groups, this gives different selectivity
•
Slightly acidic in nature
•
Used to separate steroids, amino acids,
alcohols, hydrocarbons, lipids, bile acids, vitamins and alkaloids
Cellulose
•
Plant material, porous structure, smaller pores
than paper
•
Solvent flows evenly and spots are tight
•
Used to separate hydrophilic compounds such as
sugars, amino acids, soluble inorganic ions and nuclei acids (these would
adhere too strongly to silica or alumina)
Mobile phase (solvents)
•
Cheap, analar grade
•
Low boiling point (easy to remove solvent at low
temperature)
•
Unreactive with the adsorbent and the analytes
of interest
•
Must displace the solute from adsorbent into the
mobile phase
•
Must be able to separate a mixture of solutes so
they can be identified - this is termed
the solvent selectivity
•
UV cutoff differs between solvents
(dichloromethane 245 nm)
Solvent polarities (remember like dissolves like)
water most polar
methanol
ethanol
propanone (acetone)
ethyl acetate
diethylether decreasingly polarity
dichloromethane
toluene
cyclohexane
petroleum ether
hexane least polar
Simple starting point
•
Start with a nonpolar solvent
•
Add a more polar solvent in increasing steps
•
2, 4, 8, 16, 32% polar solvent
•
This is equal to a increase in Eo of about 0.05
units
•
Aim for the target Eo
Resolution and spot size in TLC
Rs = X
0.5 (d1 +
d2)
X is the distance between the centres of the 2 spots and d1
and d2 are the average diameters of the spots
Components are just separated when Rs = 1
So, it is possible to increase resolution either by
increasing the separation of the spots or by decreasing the diameter of the
spots (HOW?)
TLC
Detection/visualization
•
Destructive
versus non-destructive methods
•
Visible
radiation (coloured compounds, dyes, pigments in paints, food colourants)
•
UV
use lamp, (rarely some compounds may undergo chemical changes)
•
Iodine
vapour (iodine dissolves in the solutes and rapidly volatilises out of the
spots leaving a blank plate within 30 mins
•
Lipid
compounds can be sprayed with water, leaving a colourless spot
Destructive
TLC Stains
•
Ninhydrin: 1o or 2o
amines (sympathomimetics)
•
Iodoplatinate: 3o
amines, alkaloids
•
UV absorption at 254 nm:
benzodiazepines, barbiturates, methaqualone
•
Fluorescence at 366:
Benzodiazepines, quinine, quinidine
TLC method development
•
What is the sample matrix and how does it need
to be prepared
•
What are the likely analytes (individual or class
of molecules)?
•
Most appropriate visualization technique?
•
What are the likely concentrations present in
the sample? How much to load on plate?
•
How to validate the method, using standards and
widely accepted methods
Limitations
•
Overloading of sample
•
Must use reference standards
•
Qualitative
•
Semi-quantitative (10% error)
•
Complex mixtures and interference
•
Detection limits vary
•
How to develop a method
Reproducibility
•
Solvent chamber saturation time
•
Quality and quantity of mobile phase
•
Freshly prepared solution (volatiles)
•
Temperature and pH
•
Adsorbent activity
•
Techniques and conditions
•
Use of standards must always be employed
•
STANDARDISE YOUR OWN PROCEDURE
Quantitation by TLC**
•
For best results spots should have an Rf of
between 0.3 and 0.7. Below 0.3 are too concentrated and above 0.7 are too
difuse
•
Visualise and scrape spot off plate
•
Add solvent to centrifuge tube and mix
•
Centrifuge and remove supernatant
•
Analyse supernatant by UV or HPLC-UV
•
Make up serial dilution series and always spot same volume of sample on plate
Level of sensitivity for quantitation
•
Visible spectrometry 100 microgram
•
UV spectrometry 50 microgram
•
NMR spectrometry 10,000
microgram
•
Gas-liquid chromatography
1 microgram
Chromatographic Column
HPLC Retention
Major parameters,
•
VR is retention volume, depends on the column type, size, and the
instrument parameters
•
Vo is dead volume, volume of the liquid phase inside the column
•
k’ is retention factor (capacity
factor),
independent of the column size
and instrument setup
Retention Characteristics
Dead Volume
Vo, Dead volume is the volume of the liquid phase
in the column
Simple rule:
Column dead
volume = 65% of the volume of empty column
typical HPLC system
Retention Parameters**
HPLC Selectivity**
Resolution
Efficiency
Efficiency Parameters**
Column Efficiency
•
Column
length is a compromise between the efficiency and backpressure
•
Column
efficiency is proportional to the column length
•
Specific
efficiency (# of particles per one plate) decreases with an increase of column
length
Silica
n rigid porous (or nonporous)
particles
n wide variety of particle and pore
sizes
n soluble in water at pH > 8
Column chemistry
silica particles (2-10 micron)
bonded chemistry: C18, C8, C6, C2, CN
tightly packed to minimise deadspace, requires high pressures to force solvent through (> 100 bar or >1 400 psi)
analytical scale- ng – mgs of material
preparative scale – mgs-grams of material
silica particles (2-10 micron)
bonded chemistry: C18, C8, C6, C2, CN
tightly packed to minimise deadspace, requires high pressures to force solvent through (> 100 bar or >1 400 psi)
analytical scale- ng – mgs of material
preparative scale – mgs-grams of material
Factors Influencing HPLC Separation
Parameters affecting efficiency:
-
Flow rate
-
Column length
-
Particle diameter
-
Particle size distribution
Parameters affecting retention factor:
-
Eluent type
-
Eluent composition
-
Stationary phase type
-
Analyte nature
Parameters affecting selectivity
-
Stationary phase type
-
Analyte nature
-
Eluent additives
-
Temperature
-
Eluent composition (ionisable analytes)
Reversed Phase
Separation Principle
Separation Principle
•
Nonpolar
(nonspecific) interactions of analyte with hydrophobic adsorbent surface (-C18,
C8, Phenyl, C4)
•
Difference
in analyte sorption affinities results in their separation
•
More
polar analytes retained less
•
Analytes
with larger hydrophobic part are retained longer
•
Almost
no separation of structural isomers
Why use the term
reversed-phase chromatography?
silica TLC plates were originally used by pharmaceutical chemists for separating compounds from organic solvents
As HPLC systems evolved in response to industry needs and advancing instrumentation, pharmacologists, toxicologists and biomedical scientists had an urgent need to identify analytes from biofluids. This required nonpolar stationary phases and polar mobile phases
The underlying principle was thus reversed, and the majority of analyses in bioscience today tend to be reversed-phase
Reversed-Phase HPLC Retention:
Neutral Analytes
Dependencies
of retention of alkylbenzenes, alkylphenones, and alkylparabenes plotted
against the number of carbon atoms in alkyl chain.
ln(k’)= m (#carbon atoms in alkyl chain) + b
High performance
liquid chromatography
Choice of normal or reversed-phase system depends on the sample matrix and target analytes
Choice of mode depends on selectivity required and presence of interfering substances in the matrix
Main advantages:
automation
wide variety of parameters to achieve selectivity
Wide variety of detectors: UV, MS, Fl, RI
Eluent Composition Effect on Selectivity
Gradient elution
alter a given chromatographic parameter over time
typically temperature, buffer strength, organic solvent composition
can retain sharp peaks throughout the separation, minimise band broadening
alter a given chromatographic parameter over time
typically temperature, buffer strength, organic solvent composition
can retain sharp peaks throughout the separation, minimise band broadening
Opiate drugs by HPLC
Variety of column chemistries
Liquid-chromatography-mass spectromety results
Sample preparation
critical that solution contains no particulates that could block the column
centrifuge, filter
urine analysis – dilute and shoot
blood analysis – cannot direct inject, can inject diluted serum
critical that solution contains no particulates that could block the column
centrifuge, filter
urine analysis – dilute and shoot
blood analysis – cannot direct inject, can inject diluted serum
References
Practical HPLC,
Meyer, 1989
Practical skills in
Forensic Science, Langford, A & colleagues (2005)
Any analytical
biochemistry or chemistry book that covers the basics of chromatography
Chromatography
Lecture 4
Learning Objectives:
to differentiate between the contexts of qualitative and quantitative analysis and validation terms accuracy and precision
to be able to compare the methods of detecting compounds: UV, colour reagents, sensitivity, selectivity
to be able to list methods for confirming identity;
use of standard compounds, reagents, mass spectrometry and nuclear magnetic resonance
performance of relevant calculations: of capacity factors and resolution
Qualitative analysis
– chromatography can indicate the presence or absence of a compounds, elements,
or ions in a sample. Eg: drugs in biofluids
Quantitative analysis – chromatography can also provide information on the chemical composition of a mixture, for example the proportion of an active ingredient in a tablet
Quantitative analysis – chromatography can also provide information on the chemical composition of a mixture, for example the proportion of an active ingredient in a tablet
Qualitative analysis
relies on the use of chemical standards for the target analytes, that is, available known compounds
there are many published methods for separation, in textbooks & catalogues, but mostly obtained from scientific journals
a major underlying assumption is that each spot (in TLC), or peak (in HPLC) has unique properties to other similar molecular structures
such as? Drug metabolites can be similar in structure to parent drug analytes
Quantitative analysis
depends on the context, what is the objective?
measure the amount in mg/mL or M of analyte
available standards?
available method
validate the method
the importance of precision and accuracy
example of the class analysing blood alcohol for Newham Police drink drive case. Half measure 79 mg/mL of ethanol in blood and the other half measure 82 mg/mL of ethanol in blood. Which is the right answer? What might be the source of errors in the analysis?
TLC – is it qualitative or quantitative?
Recall the PEI chromatography practical
what are the main limitations?
Available detection methods
sensitivity of detection limits
overloading leads to band broadening
How do we know we have achieved a
successful separation?
The success of a separation can only be measured by using an appropriate detection method
Detection methods
and their sensitivity ranges
UV/VIS variable wavelength down to 190 nm and 0.001 ABS 5 x 10⁻¹⁰
UV/VIS scanning wavelength. A diode array detector measures all wavelengths together within 0.01 s, can then select the ones of interest
5 x 10 -10
Fluorimetry very sensitive, however limited to compounds that fluoresce
1 x 10 -11
Refractive index substances in solvent have different RI, not selective, but useful when there is no chromophore (ie sugars, steroids) 5 x 10 -7
Conductive and amperometric an electical potential is applied to a cell this leads to molecules undergoing either an oxidation or reduction. This results in a current through the cell, which can be measured 10-8-10-10
Mass spectrometry measures the masses of ions. Highly sensitive > 1 10-10
radioactivity very sensitive, not much used as need to incorporate isotopes
> 1 10-10
How do we know we have achieved a
successful separation?
We need to mathematically state the result of a separation
The time between sample injection and an analyte peak reaching a detector
at the end of the column is termed the retention time (tR ).
Each analyte in a sample will have a different retention time. The time
taken for the mobile phase to pass through the column is called tM.
A term called the retention factor (or capacity factor), k', is often
used to describe the migration rate of an analyte on a column.
The retention factor for analyte A is defined as;
k'A = t R - tM / tM
t R and tM are easily obtained from a chromatogram.
When an analytes retention factor < 1, elution is so fast that
accurate determination of the retention time is very difficult.
High retention factors (> 20) mean that elution takes a very long
time.
Ideally, the retention factor for an analyte is between one and five.
We define a quantity called the selectivity factor, a , which describes
the separation of two species (A and B) on the column;
a = k 'B / k 'A
When calculating the selectivity factor, species A elutes faster than
species B. The selectivity factor is always greater than one.
Possible criteria for
selection of a particular chromatography method
•
The required level of accuracy and precision
•
The number of samples to be analysed
•
The amount of each sample available for analysis
(eg: urine vs saliva)
•
The physical form of the samples (solids, liquids,
tissues)
•
The expected concentration range of the analyte in
the samples
–
picograms, nanograms, micrograms, milligrams
•
The sensitivity and detection limit of the technique
•
The likelihood of interfering substances
(preparation required?)
•
The speed of the analysis
•
The ease and convenience of the procedure
•
The skill required by the operator
•
Cost and availability of the equipment
Validation
•
Is
the process whereby accuracy and precision of a particular analytical method
are checked in relation to specific standards, using an appropriate reference
material containing a known amount of analyte
•
is
a method fit for purpose?
•
under
which conditions, limitations, margins of error
•
instrumentation
•
calibration
•
validation
Terms of Validation
•
Selectivity
is the extent to which a method is free from interference due to other
substances n the sample
•
Sensitivity
is the ability to discriminate between small differences in analyte
concentration
•
Detection
limit is the minimum amount of concentration of an analyte that can be detected
at a particular confidence level
•
Sources
of errors: method, instrument, materials, analyst
precision and accuracy
•
Precision is the extent of mutual agreement between
replicate data values for an individual sample
•
(high accuracy but low precision)
•
Standard deviation s and
relative standard deviation % RSD see separate learning material
•
Accuracy is the closeness of an individual
measurement, or a mean value based on a number of measurements, to the true
value
•
(high precision but low accuracy)
precision and accuracy
Sample preparation
critical that solution contains no particulates that could block the column
centrifuge, filter
urine analysis – dilute and shoot
blood analysis – cannot direct inject, can inject diluted serum if precipitate proteins first
critical that solution contains no particulates that could block the column
centrifuge, filter
urine analysis – dilute and shoot
blood analysis – cannot direct inject, can inject diluted serum if precipitate proteins first
Internal standard 1
where you add a known amount of a reference substance (not originally in the sample) to the sample to give an additional peak in the HPLC profile
then determine the response of the detector to both the test and reference substances, by analysing a standard containing known amounts of both substances to provide a response factor (r) where
r = peak area (or height) of test substance
peak area (or height) of reference substance
use this response factor to quantify the amount of test substance (Qt) in a sample containing a known amount of the reference substance (Qr):
Qt = [peak area (or height) of test substance] x Qr
[peak area (or height) of reference substance] r
Internal standard 2
add to the sample at the first stage in the extraction so any loss or degradation of test substance during purification will have a similar effect on the internal standard
only holds true if the extraction characteristics are the same for the IS and the target analyte
IS should be chemically similar to the test substance
hopefully of similar polarity, but not identical WHY?
Typical HLPC chromatograms
LHS shows blank sample, note the Internal Standard (IS)
RHS shows 4 standard peaks added, labelled A-D
Example of a standard curve
Peak height ratio is used in this example
Use height or area under the peak, which is best and why?
Pharmacokinetic of Mebudipine (b) in Rabbits
Three adult male albino rabbit
were each administrated single bolus intravenous doses of 0.50 mg/kg mebudipine
dissolved in 60% PEG 400). Blood samples were collected from marginal ear vein
at 5, 10, 20, 30,60, 120, 180,240 min after mebudipine administration
To one ml of plasma sample were
added, 10 μl of internal standard (dibudipine, 20 mg/ml) solution and 0.5 ml of
1M NaOH.
The solution was mixed for a few
seconds. 5 ml ethyl acetate was added to the solution which was subsequently
shaken on horizontal shaker for 10 minutes. Evap under N2 and recon in 200 ul
mobile phase
Intra and interday variation of
mebudipine assay in rabbit plasma
mean (n=3) calibration curve for
mebudipine was y=0.008x - 0.0022, r2 =0.9989
where, y and x are the peak height ratio and concentration (ng/ml),
respectively. Mebudipine @ 10 ng/ml could be quantified.
Mean mebudipine plasma concentration-time profile in rabbits following IV
administration of 500 mg/kg
mebudipine. Each point represents the mean ± SE for three rabbits.
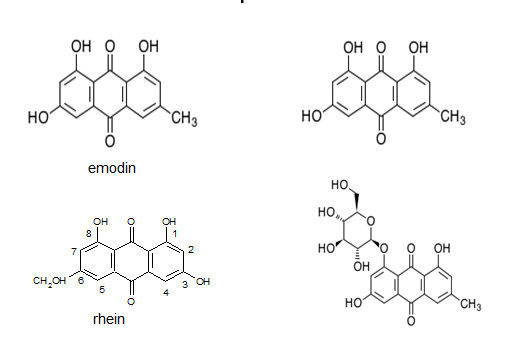
MHRA advisory April 2006
•
As of 30 March 2006, seven reports of suspected
adverse reactions associated with Polygonum
multiflorum have been reported to the MHRA through the Yellow Card
Scheme.
•
All 7 reports are of liver reactions and comprise
one report of abnormal liver function, 3 reports of jaundice, 2 reports
hepatitis and one report of jaundice and hepatitis. The patients, 5 women and 2
men aged from 36 to 70 years old, were taking Polygonum multiflorum for hair loss (3 patients had taken the
product Shen Min and 3 patients had taken the product Shou Wu Wan). All the
patients had recovered or were recovering after stopping Polygonum multiflorum.
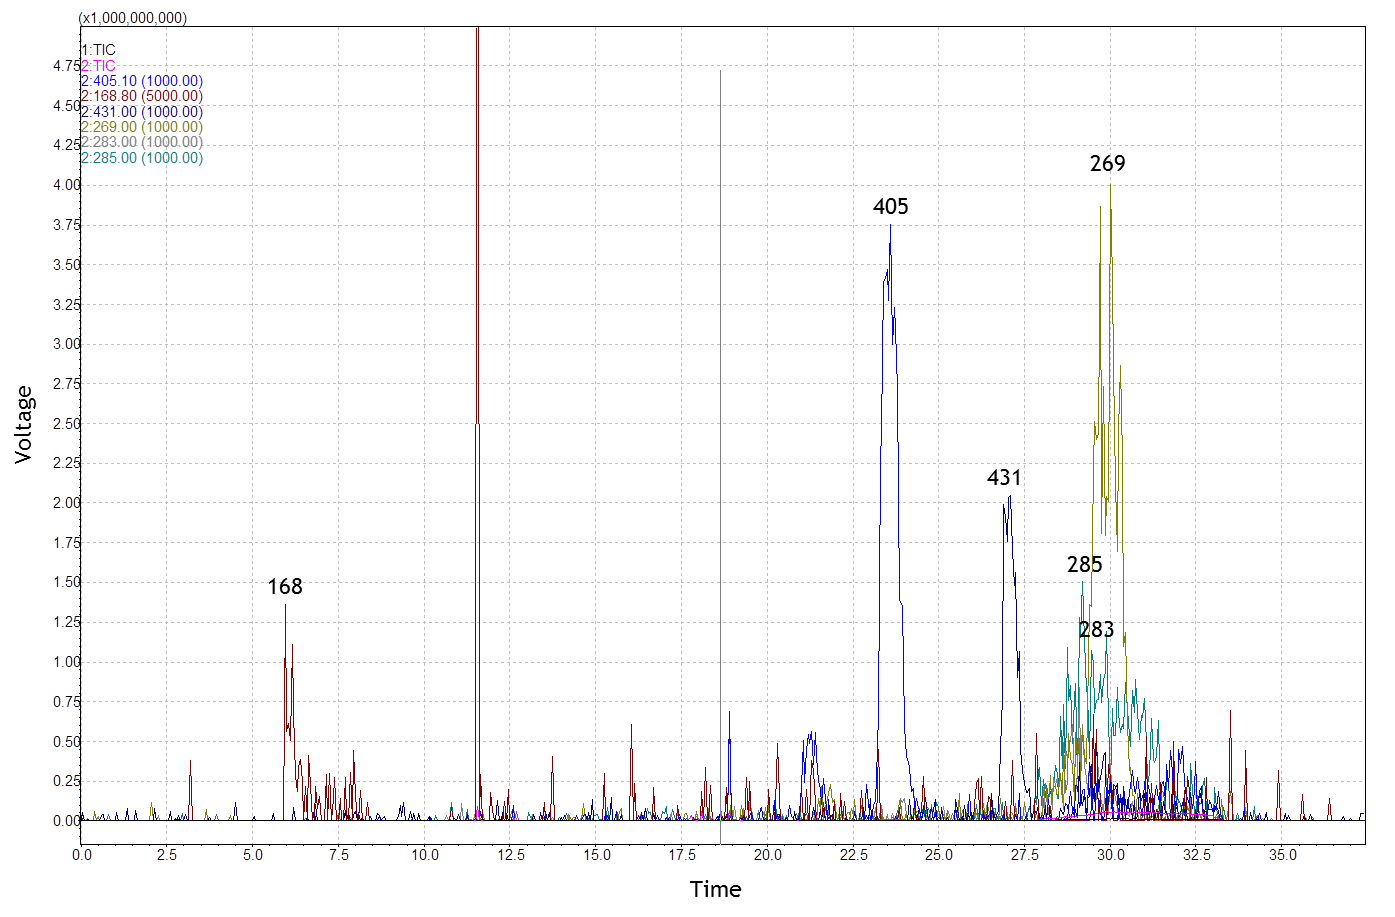
HPLC of methanol extracts from
tablets
LC-ESI-Mass spectrometry
MHRA interest
Is it possible to discern which
level of processed drug is present in a given OTC
Is the level of HSB interesting?
Is it possible to discern which
level of processed drug is present in a given OTC
Is the level of HSB interesting?
J Gao, A Sanchez-Medina, BA Pendry, MJ Hughes,
GP Webb and O Corcoran. Validation of a HPLC method for flavonoid biomarkers in
skullcap (Scutellaria) and its
use to illustrate wide variability in the quality of commercial tinctures.
Journal of Pharmacy and Pharmaceutical Sciences, 2008, 11 (1): 77-87.
A Sanchez-Medina, CJ Etheridge, GE Hawkes, PJ
Hylands, BA Pendry, MJ Hughes and O Corcoran. Comparison of rosmarinic acid
content in commerical tinctures produced from fresh and dried lemonbalm (Melissa officinalis). Journal
of Pharmacy and Pharmaceutical Sciences, 2007, vol 10, no 4, 455-463.
Find these scientific articles using Pubmed or
Science Direct.
Test your understanding of the technical
aspects of the paper, as related to the theory covered in these 6 lectures.
job descriptions requiring experience in chromatography
PDP, how do we get chromatography experience at UEL?
PDP, how do we get chromatography experience at UEL?
Hot job websites
www.newscientists.com
www.jobs.ac.uk
careful keyword search
London, UK, Europe, etc
www.newscientists.com
www.jobs.ac.uk
careful keyword search
London, UK, Europe, etc
http://teaching.shu.ac.uk/hwb/chemistry/tutorials/chrom/chrom1.htm
this is an appropriate academic website tutorial
Remember the story of the UEL graduate who won a job in LGC Ltd because the boss noticed her 3rd year undergraduate project title?
It could be YOU!
Check out the Medicines Research Group at UEL and associated 3rd year projects on HPLC and quality analysis.
http://www.uel.ac.uk/mrg
Section E: chromatography
1. which separation mode is typically used to separate drugs from proteins?
2. distinguish between the use of quantitative and qualitative chromatography
3. which equation defines the resolution of two HPLC peaks?
4. which detection methods are suitable for proteins, small drug molecules?
5. briefly describe gradient elution and how it can be used in chromatography
6. why is reversed-phase chromatography so named?
describe an application of reversed-phase chromatography in biofluid analysis
7. draw a flow chart for the main components of a HPLC system. Where in the system does the chemistry of separation takes place?


Thanks for sharing an informative post, If you wants to know about Immunoaffinity Chromatography Germany This is the right place for you.
ReplyDeleteGreat blog! Thank you for sharing.
ReplyDeleteDownload Indian Doctors Network where you can network and communicate with executive committee members, senior doctors and mentors.